
Ask anyone on the street what a city spends annually for pothole repairs and they'll likely say it's not enough. Chances are slim you'll hear a dollar figure or a year-over-year comparison.
For the layman, government budgets can appear as complex, dense documents, rather than useful roadmaps of an organization's annual priorities and performance.
Forward-thinking government officials not only publish data in its raw form, but they also provide a way for the public to understand and use the data through maps, visualizations, APIs to remix and reuse the information, and user-friendly apps that engage and connect people to their government. By sharing a dollar-by-dollar view into the budget, elected officials and department managers can demystify the complexity and questions around government finances with ease.
Seattle, Washington
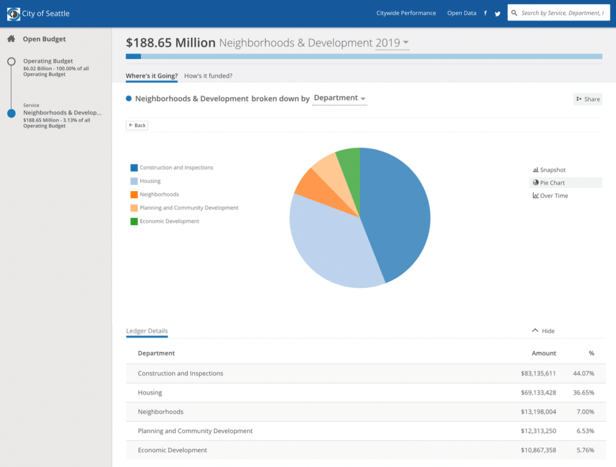
The city of Seattle takes an advanced approach to its financial transparency site. The city breaks down expenditures by service, such as arts and culture, education and human services, and neighborhood development. By drilling into the categories, users can see what percentage of the budget an amount represents. For example, the city's neighborhoods and development services account for about three percent of the city's operating budget.
Chattanooga, Tennessee
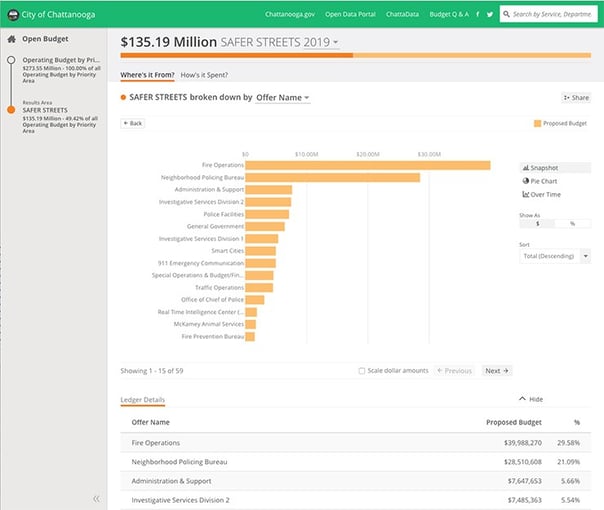
The city of Chattanooga uses an open budget platform for an innovative approach to finances. Its site, hosted on ChattaData, shows the budget with standard views by department or office. It also shows a breakdown by priority areas and results, such as safer streets, stronger neighborhoods, high-performing government, smarter students and stronger families, growing economy, and essential costs.
Las Vegas, Nevada
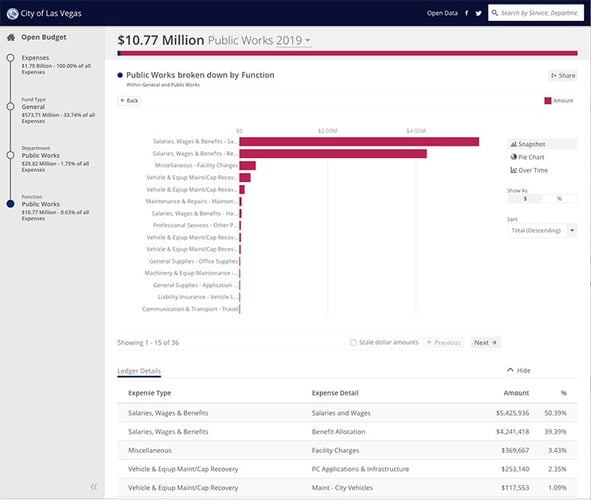
Las Vegas, for example, showcases its Open Budget app front and center on the landing page of the city's open data portal. The app gives details for 11 functions represented in the city budget, including public safety, cultural and recreation, and capital improvement projects. Las Vegas uses an additional open checkbook app that shows checkbook-level spending details, including details on vendor payments for traffic improvements and other public works projects.
Counties and States
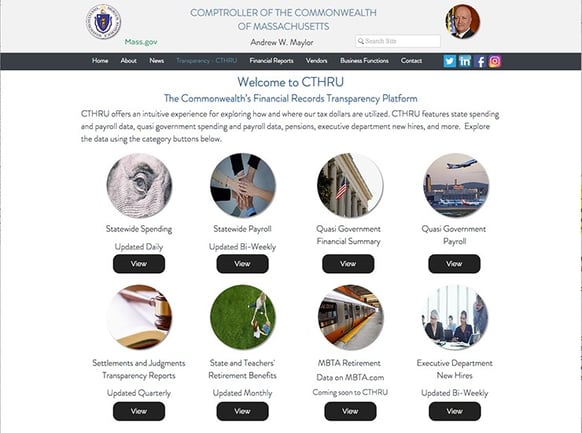
It's not just cities that need to share financial information; counties and states are facing the same challenges. Massachusetts' state financial transparency site, CTHRU, is a leading example of government innovation. The site reached 3 million pageviews at the end of 2018, tripling its reach in nine months. The comptroller makes almost weekly enhancements to the financial transparency platform. Along with statewide budgeting and spending, it also shows payroll data, state and teacher retirement benefits, and executive branch new hire data.
Data in Action
Implementing principles of transparency, participation, and collaboration around a government’s budget offers great return on investment. Accessible budget tools and platforms move users through the entire budgeting process in an engaging way by showing the data in dynamic, interactive charts. Innovative apps allow users to follow the lifecycle of the budgeting process, helping the public, and even internal government employees, understand everything that goes into a government's budget, including operating and capital priorities.
Learn more about how to empower the public with financial data in Best Practices for Agency Financial Initiatives: From Reactive to Proactive Data Sharing.

Reprinted with permission from the June 2019 ICMA Blog, published and copyrighted by ICMA, the International City/County Management Association, Washington, D.C.